Quarterly Training Updates
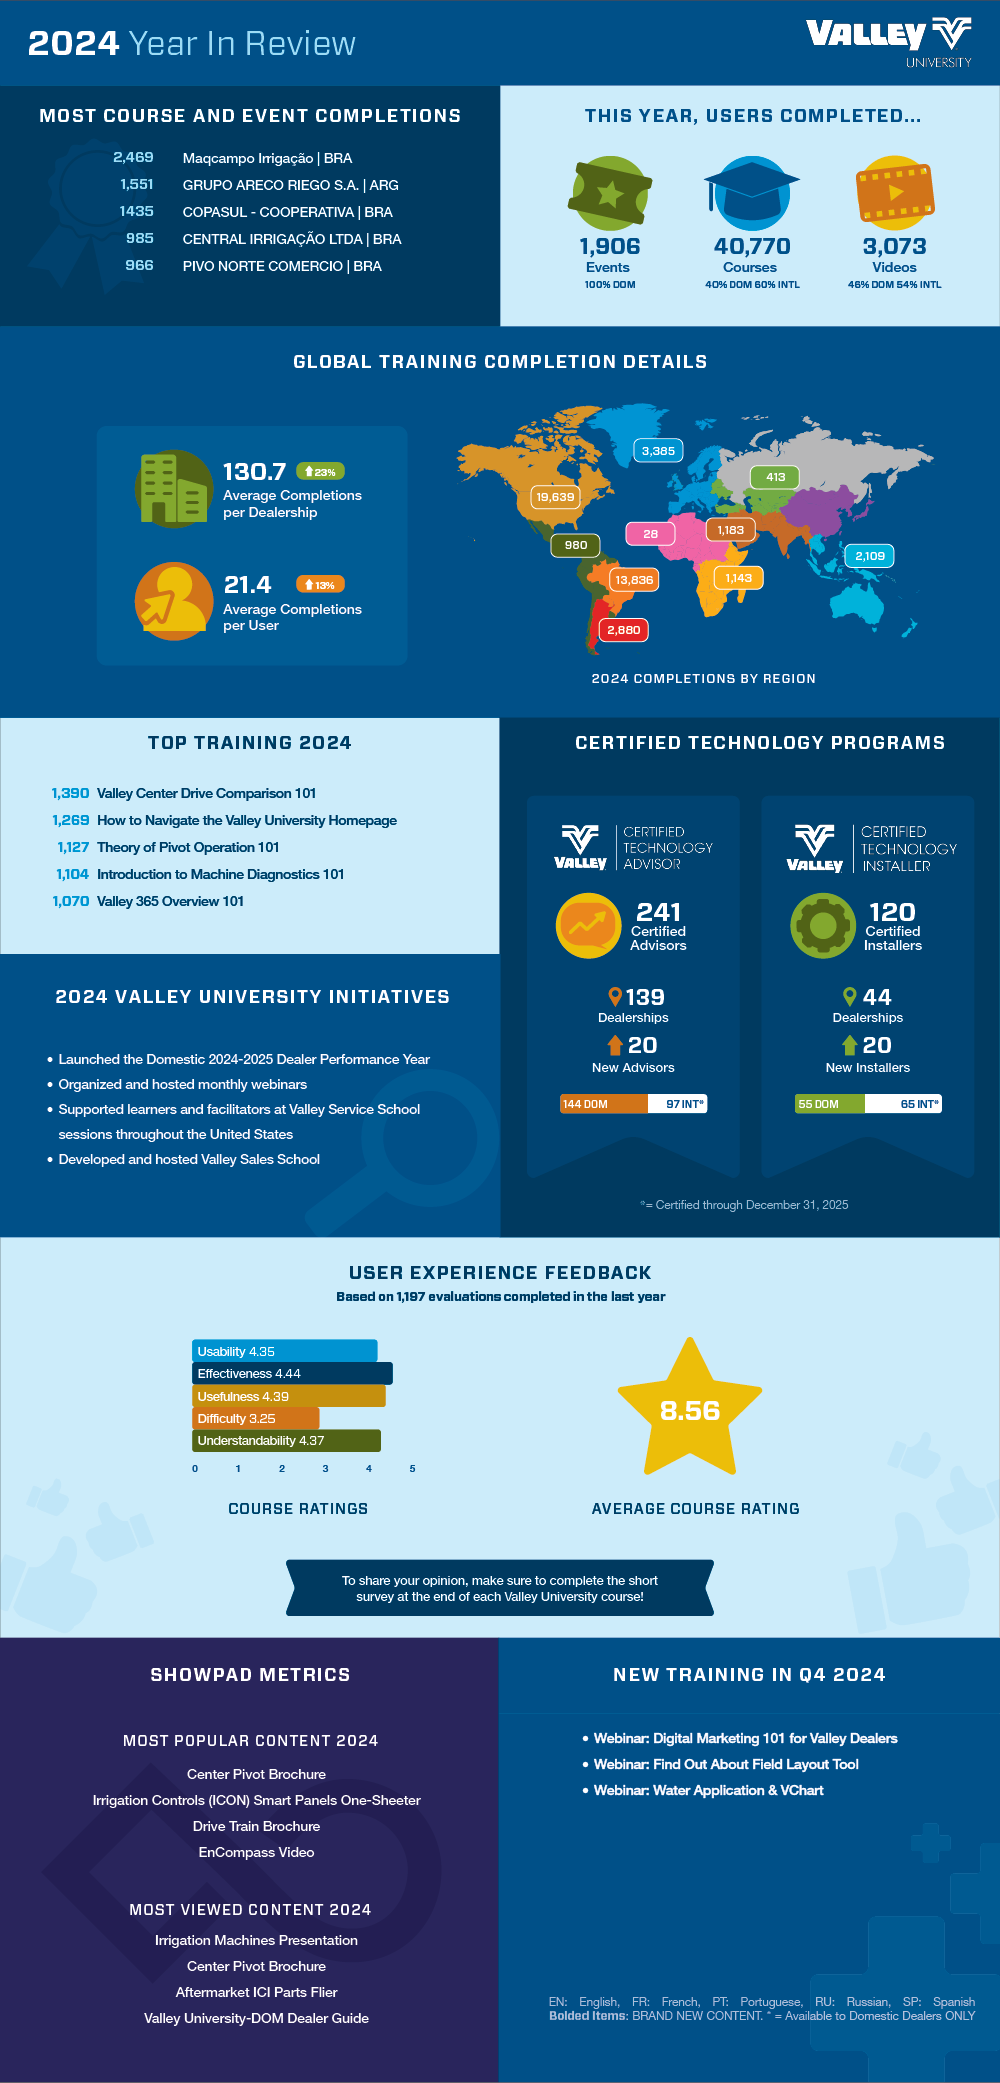
Each quarter, the Valley University team releases a graphic of condensed statistics that outline major trends across our training. These trends include which trainings are most popular, how many training completions each region had, which dealerships completed the most trainings, and many more.
In 2024, I redesigned the existing Quarterly Update template to better reflect the established graphic language that appeared in our courses and other communications. To populate the update, I compiled information from our Learning Management System using PowerBI. To send the update, our team created a report of active LMS users and built out the email in HubSpot. For users who had opted out of email, this graphic is also available on Showpad.
This email was viewed by more dealers than our average monthly send, and had an open rate of 40%.
CATEGORY
Communication
ATTRIBUTES
Marketing
Reporting
Adobe Illustrator
HubSpot
Showpad
Salesforce
PowerBI